Feature · Reporting
Four tabs, real transactions, no vanity metrics.
Overview, Revenue, Sales, and Team & Costs — each answering a different question, all backed by actual transactional data rather than a dashboard of numbers that only go up.
What you get from reporting
Organised by the question you're asking
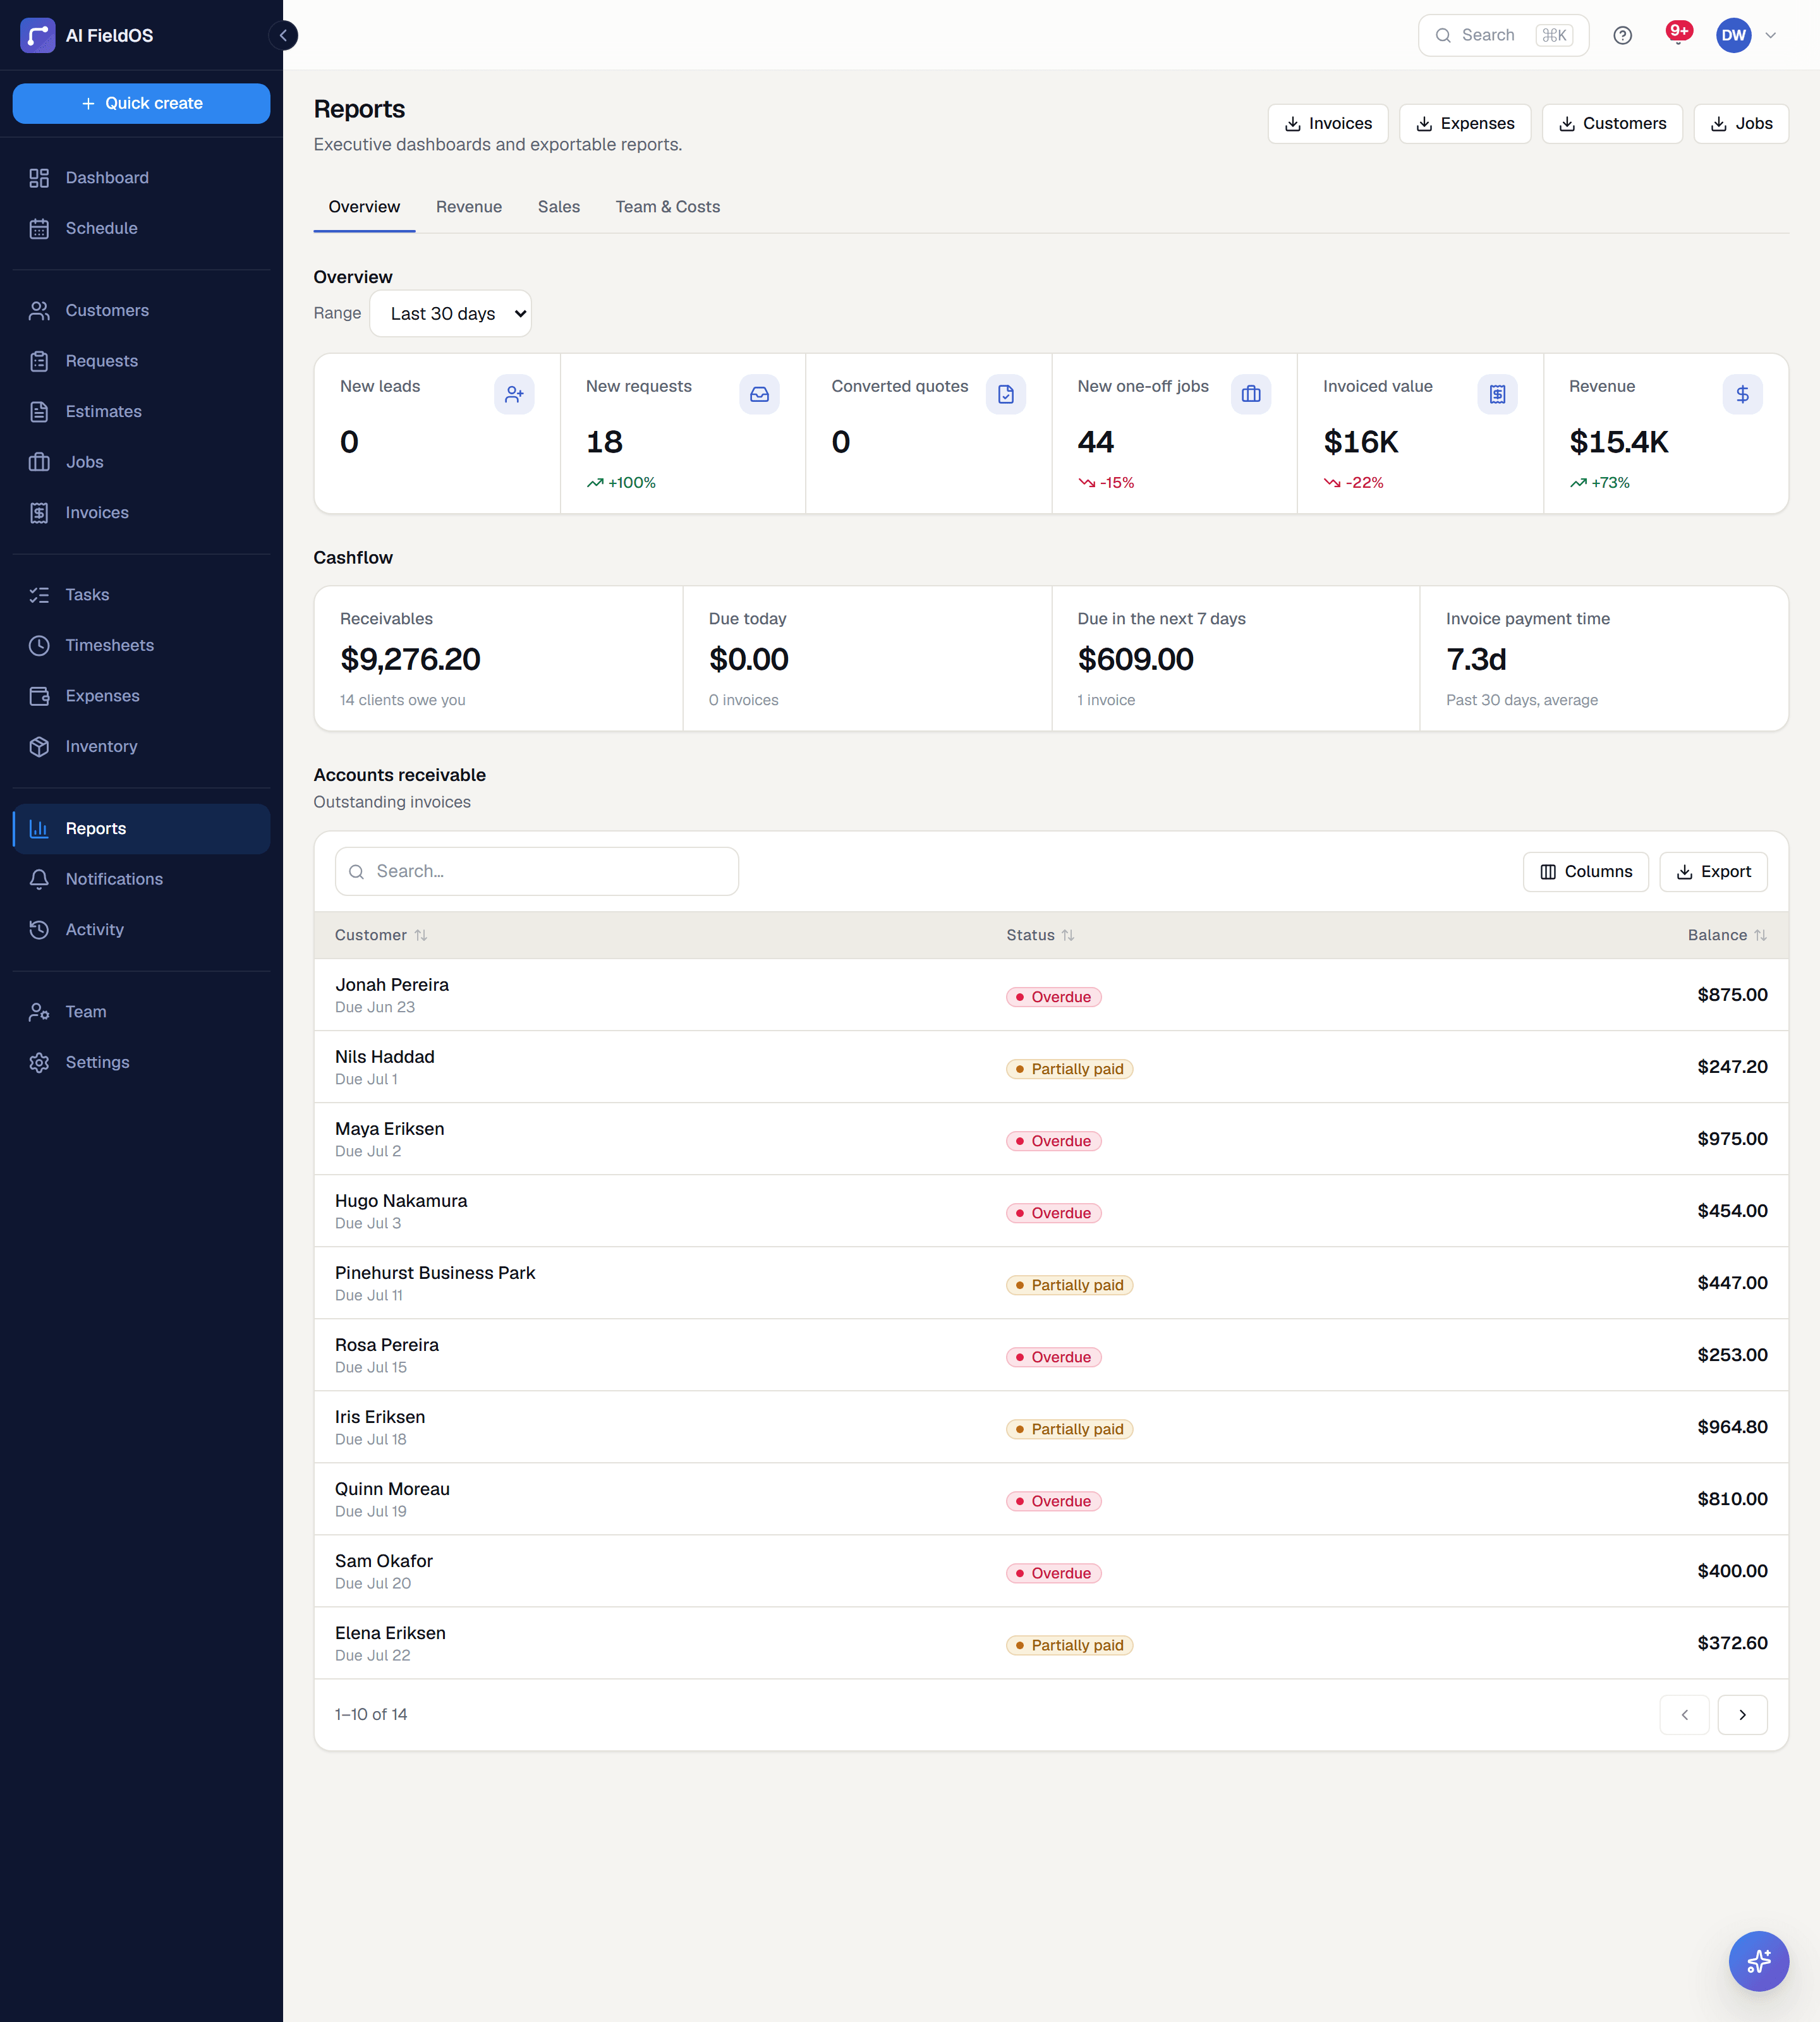
Four focused tabs rather than one endless scroll: period stats and cashflow; year-over-year revenue against a goal you set; lead and quote conversion; team productivity and cost.
Charts that don't lie about gaps
Months that haven't happened yet are left blank, not drawn as zero. The revenue heatmap shades each day against that month's own busiest day, so a small shop and a large one both get a chart that distinguishes anything.
Cashflow you can act on
Total receivables with client count, invoices due today, invoices due in the next 7 days as a separate non-overlapping bucket, and average payment time over 30 days.
Three steps, start to finish
Pick a period — this month, last 30 days, this year.
Work through the tab that matches your question rather than scrolling past everything else.
Export invoices, expenses, customers, or jobs to CSV, permission-gated the same as the management pages.
Straight answer
What this doesn't do
Every limit below was checked against the code. We'd rather you find them here than three weeks after migrating.
- Fixed reports, not a custom report builder.
- No scheduled report emails — you open the page or export the data.
Common questions
No — the reports are fixed rather than a query builder. Every underlying list exports to CSV, so custom analysis happens in a spreadsheet.
Ready to run your business on it?
Start a 14-day trial today. No credit card, no sales call, no implementation project.
14 days free · No credit card required · Cancel anytime